
AIOps for IT operations means applying machine learning to your operational data (metrics, logs, traces, alerts and change records) to group related alerts, flag unusual behaviour and suggest likely causes, so on-call engineers can triage incidents faster. It doesn't replace monitoring or SRE practice. It can only be as good as your SLOs, alerts and telemetry.
What does AIOps mean for IT operations?#
AIOps is a set of machine learning techniques that sit between your monitoring tools and your on-call engineers. They turn a flood of signals into a short list of incidents with context attached.
Gartner, which coined the term, says AIOps "combines big data and machine learning to automate IT operations processes, including event correlation, anomaly detection, and causality determination". In day-to-day work, that comes down to four jobs:
- Deduplication: collapsing 200 copies of the same alert into one.
- Correlation: recognising that a database latency alert, an API error alert and a queue backlog alert are all one incident.
- Anomaly detection: spotting behaviour that breaks a learned pattern, such as traffic that's normal on a Monday but strange on a Sunday.
- Cause suggestion: pointing at the likely trigger, often a deploy, config change or failing dependency, and sending the incident to the team that owns it.
Some platforms add a fifth job, which is running a runbook step automatically. Treat that as a separate decision with its own controls.
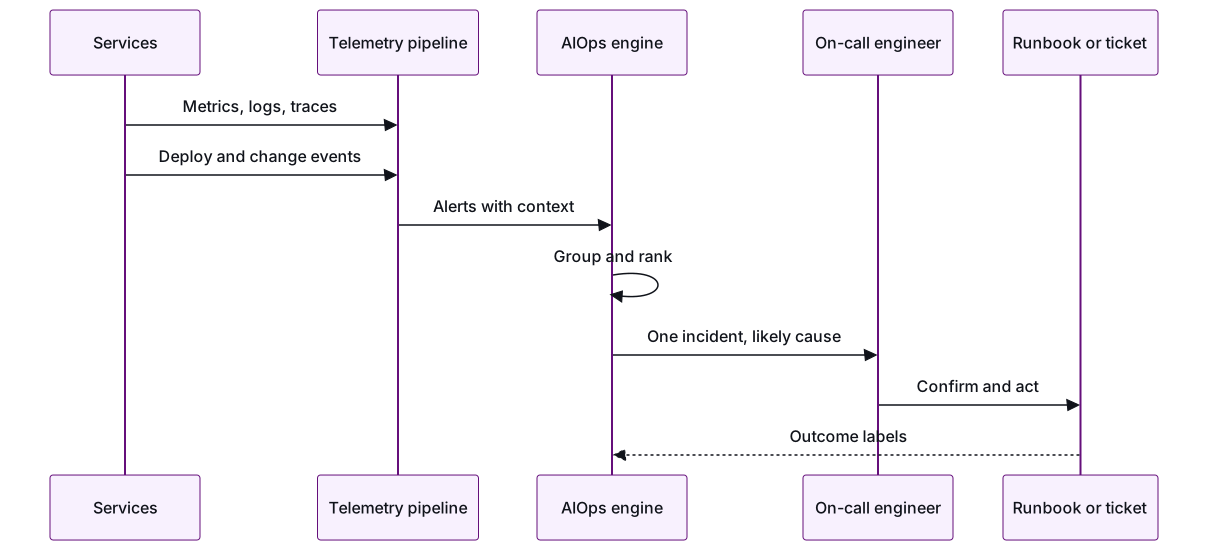
The last arrow matters most. If engineers never record whether a grouping was correct or what actually caused the incident, the system has nothing to learn from.
Which problems does AIOps solve and which does it not solve?#
AIOps helps when you have too many alerts. It can't help when the alerts you need don't exist, or when nobody owns what they point at.
The noise problem is real. In a 2026 survey of IT production teams reported by Carrier Management:
- 77% of on-call teams get at least ten alerts a day.
- 57% say fewer than 30% of those alerts are actionable.
- 83% of engineers ignore or dismiss alerts at least occasionally.
- 44% had an outage in the past year linked to suppressed or ignored alerts.
- 78% had at least one incident where no alert fired at all.
Splunk's State of Observability 2025 report, which surveyed 1,855 ITOps and engineering professionals, found that 13% of respondents globally admit to ignoring or suppressing alerts.
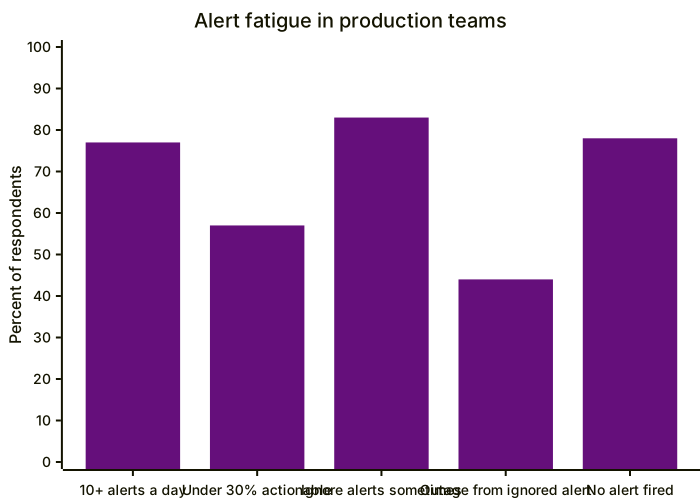
Look closely at those numbers. AIOps can work on the first four, because grouping and ranking cut how many pages engineers get and how often they ignore one. It does nothing about the fifth. If no alert fired, there was no signal to correlate. That's an instrumentation gap, and you close it with better telemetry and symptom-based alerts, not a smarter model.
What AIOps handles well:
- Alert storms during a cascading failure
- Linking incidents to recent deploys or config changes
- Routing to the right team when ownership data is accurate
- Seasonal patterns that fixed thresholds handle badly
What it doesn't fix:
- Services with no instrumentation
- Alerts on causes (CPU at 80%) rather than user impact
- Services with no clear owner
- Missing or outdated runbooks
- Unreliable releases that cause the incidents to begin with
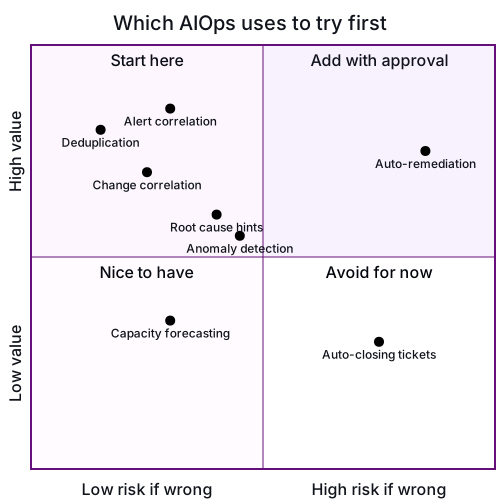
Not every AIOps feature carries the same risk. Grouping duplicate alerts is cheap to get wrong, because an engineer can still see the underlying alerts. Automatically restarting services or closing tickets is expensive to get wrong. Start in the top-left of this chart.
What data does AIOps need before it can help?#
AIOps needs consistent telemetry, change events, an accurate list of services and owners, and labelled incident history. Without all four, correlation is just guessing.
- Telemetry signals. OpenTelemetry currently supports traces, metrics, logs and baggage, with events and profiles still in development or at the proposal stage. A vendor-neutral standard lets you change tools later without instrumenting everything again.
- Consistent labels. Every alert needs the same service name, environment, severity and owning team. If one tool calls a service "checkout" and another calls it "checkout-svc-prod", correlation fails before any model runs.
- Change events. Deploys, feature-flag flips, config pushes and infrastructure changes, all with timestamps. Most incidents begin with a change, so this is often the most useful data you can give AIOps.
- Topology and ownership. Which service calls which, and who owns each one. This drives both correlation and routing.
- Incident history with outcomes. Past incidents tagged with the real cause and with which alerts were noise. That's the ground truth you'll use to judge any tool.
Keep enough history to cover your normal cycles. If traffic follows a weekly pattern, a model trained on four days of data will flag every Monday as an anomaly.
Why should SLOs and clean alerts come before AIOps tools?#
SLOs tell you which alerts matter to users. If you feed AIOps alerts without that, it learns to rank noise.
Google's SRE guidance is direct about this. The Monitoring Distributed Systems chapter says effective alerting has "good signal and very low noise". It recommends putting far more effort into catching symptoms than causes, and says alerting configuration that's rarely exercised (less than once a quarter for some teams) should be up for removal.
The SRE Workbook chapter on alerting on SLOs shows how to put this into practice. Alert on how fast you're using up your error budget (the burn rate), not on raw thresholds. With a 99.9% SLO over 30 days, a constant 0.1% error rate uses up the budget exactly by the end of the window, which is a burn rate of 1. Spending 5% of the budget in a single hour takes a burn rate of 36. The workbook calls multiwindow, multi-burn-rate alerts the most appropriate approach in most cases.
Do this before buying anything:
- Define one or two SLOs per critical service, in terms users would recognise (successful checkouts, search latency).
- Replace cause-based pages with burn-rate alerts. Turn cause alerts into dashboards or tickets.
- Delete alerts that haven't fired, or haven't led to any action, in a quarter.
- Make sure every remaining alert has an owner and a runbook link.
This often cuts paging by more than any tool would. It also gives you a clean definition of "an incident that mattered", which you'll need to judge an AIOps pilot. This is where our Observability & SRE work starts: SLOs users would recognise, OpenTelemetry instrumentation, and cutting alerts down to the ones that matter.
How do you pilot AIOps on one service with a measured baseline?#
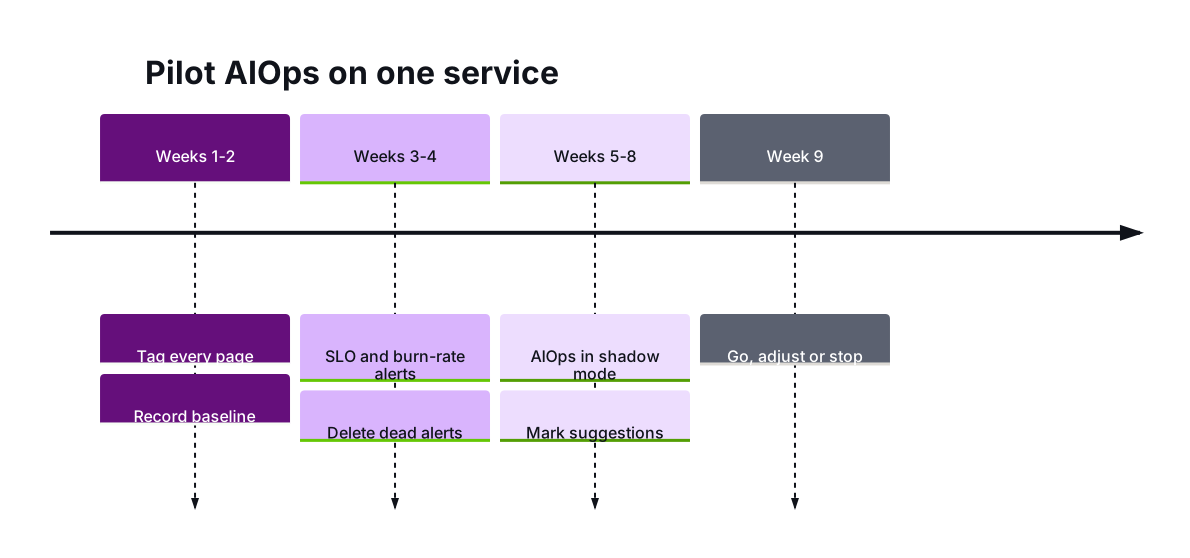
Pick one noisy service with a clear owner. Measure its on-call load for a few weeks, clean up its alerts, then run AIOps in suggest-only mode and compare against the baseline.
Pick the service. Choose one that pages often, has a single owning team and already sends telemetry. Avoid your most critical system for the first round.
Record a baseline. Tag every page for two weeks:
- Total alerts and total pages per week
- Share of pages that were actionable
- Time to acknowledge and time to restore
- Incidents found by users or other teams before any alert fired
Clean up first. Add the SLO and burn-rate alerts and remove dead ones. Measure again. Some of the improvement will come from this step alone, and you should credit it there, not to the tool.
Run in shadow mode. Let the AIOps tool group incidents and suggest causes, but not act. Engineers mark each suggestion right or wrong.
Decide with criteria set in advance. For example: pages per week down by an agreed share, no drop in actionable rate, no missed SLO breaches, and cause suggestions correct often enough that engineers check them first. Agree a stop rule too. Our guide to why AI automation projects fail covers the usual ways pilots without a baseline or owner stall.
Read recovery time together with change failure rate, not on its own. Our post on DORA metrics when AI writes your code explains why one metric improving can hide another getting worse.
What should you check when a vendor sells AIOps?#
Ask the vendor to prove the claims on your own past incidents, show why it grouped what it grouped, and keep a person in charge of any action it takes.
| Check | Good answer | Red flag |
|---|---|---|
| Proof on your data | Replays your last 90 days of incidents and shows grouping accuracy | Only shows benchmarks from other customers |
| Explainability | Shows which signals and changes linked alerts together | "The model decided" |
| Noise reduction | Separates deduplication from suppression and reports both | One headline percentage |
| Data standards | Takes in OpenTelemetry and exports your data and rules | Proprietary agents only, no export |
| Actions | Suggest-only by default; approval and audit trail for risky steps | Auto-remediation switched on out of the box |
| Data terms | Clear on retention and whether your telemetry trains shared models | Vague or missing answers |
| Cost | Pricing tied to a unit you can forecast (hosts, GB, events) | Costs that grow faster than your traffic |
One test is worth more than the rest. Hand the vendor three past incidents you already understand and see whether the tool reaches the same conclusion. If it can't explain incidents you've already solved, it won't help with the ones you haven't.
Conclusion#
AIOps is useful for one specific job: cutting a stream of alerts down to a few incidents with likely causes attached. It works best on top of good telemetry, SLO-based alerts, clear ownership and labelled incident history, and it can't stand in for any of them. Do the SRE groundwork first, then pilot one service against a baseline and let the numbers decide.
At Calidad, DevOps and AIOps are part of our Platform Modernization work. We start with a paid pilot: one pod, one outcome, and success criteria agreed up front.
Frequently asked questions
Is AIOps the same as observability?
No. Observability is your ability to understand a system from its telemetry: traces, metrics and logs. AIOps is an analysis layer that runs on that telemetry to group alerts, find anomalies and suggest causes. Without observability, AIOps has nothing reliable to work with.
How long should an AIOps pilot take?
Plan for about two months on one service: two weeks of baseline, two weeks of alert cleanup and SLO setup, then four weeks in shadow mode. Weekly traffic patterns mean shorter pilots tend to produce false anomalies. Set success criteria and a stop rule before the pilot starts.
Should AIOps be allowed to fix incidents automatically?
Not at first. Start with suggest-only grouping and cause hints, where a wrong answer costs little. Add automated actions one runbook step at a time, with an approval step, scoped permissions and an audit trail for anything that's hard to undo.
Can we get AIOps benefits without buying a platform?
Often, yes. A lot of the noise reduction comes from replacing cause-based alerts with SLO burn-rate alerts, deleting alerts nobody acts on, and adding consistent service and owner labels. Do that first. It shows whether a tool would add enough on top to justify its cost.
Does a GCC in India need its own AIOps setup?
Usually not. A capability center works best on the same telemetry, SLOs, alert routing and runbooks as headquarters, so incidents are handled the same way across time zones. Separate tooling tends to split ownership and makes correlation harder.
- AIOps
- IT Operations
- Observability
- SRE
Newsletter
Get new articles by email
A short monthly round-up of what we've written on engineering pods, quality and AI. No spam.
