
DORA metrics are four measures of software delivery: deployment frequency, lead time for changes, change failure rate and failed deployment recovery time. The first two track speed. The last two track stability. When AI writes much of your code, read all four together, because speed can go up while failures and recovery time quietly get worse.
What are the four DORA metrics and what does each measure?#
The four DORA metrics measure how fast changes reach production and how often those changes break something. The DevOps Research and Assessment (DORA) team found these four key metrics over six years of research, and they are still the standard way to talk about delivery performance.
| Metric | What it measures | Speed or stability |
|---|---|---|
| Deployment frequency | How often you deploy to production | Speed |
| Lead time for changes | Time from commit to running in production | Speed |
| Change failure rate | Share of deployments that cause a failure needing a fix | Stability |
| Failed deployment recovery time | Time to restore service after a bad deployment | Stability (see note) |
There are two recent changes to know about. In its 2024 report, DORA moved time to restore into throughput and added rework rate as a stability measure. Rework rate counts unplanned deployments made to fix production problems. Some guides now say the four keys became five because of this. The original four are still what most dashboards show, so this post uses them and brings in rework rate where it helps.
How do you measure DORA metrics from your pipeline data?#
You get DORA metrics from events your tools already record: commits, deployments and incidents. You don't need surveys. DORA's open-source Four Keys project collects data from GitHub or GitLab and shows daily figures plus a snapshot of the last 90 days. You can build the same thing with any CI/CD system.
The work is mostly about agreeing on definitions:
- Deployment: a production release that users can reach. Don't count staging pushes or config syncs that change nothing.
- Lead time start: the first commit on the change, not the moment the pull request is merged.
- Failure: a deployment that causes an incident, a rollback or a hotfix. Write this down, or every team will count it differently.
- Recovery: the time from when a failure is detected to when service is restored, measured by monitoring, not by when a ticket was closed.
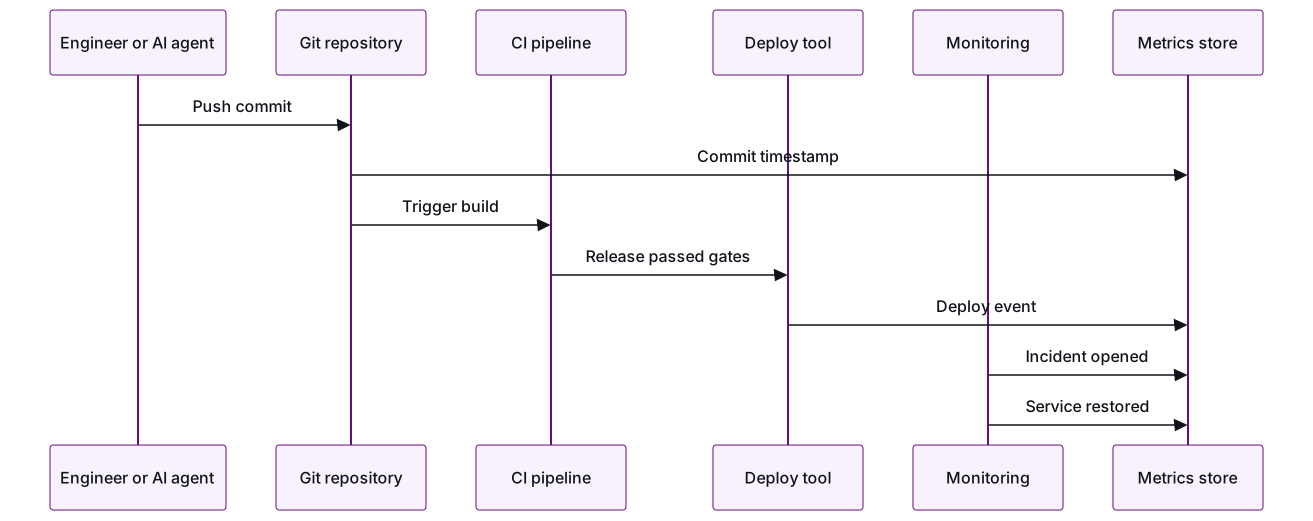
Store each event with the service name and the commit SHA. With those two fields, you can join a production incident back to the deployment that caused it. That join is what makes change failure rate trustworthy.
How does AI-generated code distort deployment frequency and lead time?#
AI coding tools can make the speed metrics look better without the system actually getting better. They produce more changes, and coding time drops, but the review, testing and recovery work behind each change doesn't shrink.
DORA's own research shows this tension. In 2024, a 25% increase in AI adoption went with better documentation, code quality and review speed, but also with a 1.5% drop in delivery throughput and a 7.2% drop in delivery stability.
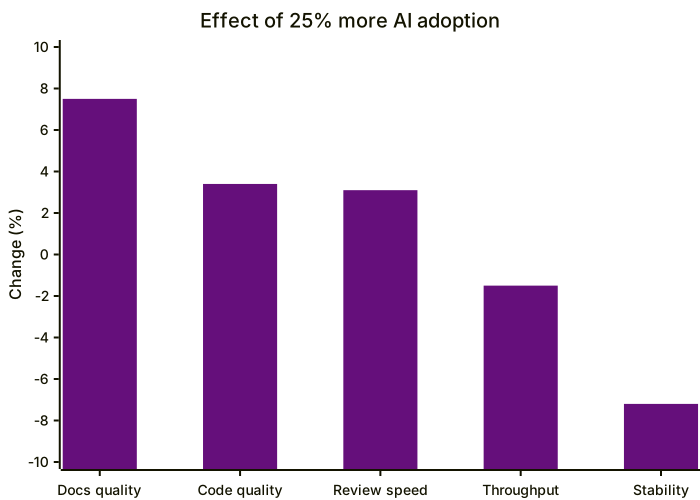
By 2025 the throughput result had reversed: AI adoption now correlates positively with throughput, but instability remains elevated. DORA itself says higher AI adoption is associated with increases in both throughput and instability. That is the pattern to watch on your own dashboard.
Here is how the inflation happens in practice:
- Deployment frequency goes up because there are more small, low-value changes: generated refactors, dependency bumps and tweaks to tests. Each one counts as a deploy.
- Lead time looks shorter at the start because code gets written faster. But large AI-written pull requests often wait longer in review, so the total from commit to production can stay flat or grow.
- Throughput per engineer rises, and the number of changes a senior engineer has to review rises with it. Review becomes the place where the speed gain is lost or kept.
Why does change failure rate matter more when AI writes the code?#
Change failure rate is the metric most likely to show whether AI-written code is safe, because it counts what actually broke in production. Output volume tells you nothing about that. If deployment frequency doubles and change failure rate stays flat, users see twice as many failures.
AI-written code tends to fail in ways that pass a quick look. It compiles, it reads well, and it gets an edge case, an authorization rule or a data assumption wrong. These failures show up after release, which is why you need to track change failure rate together with rework rate.
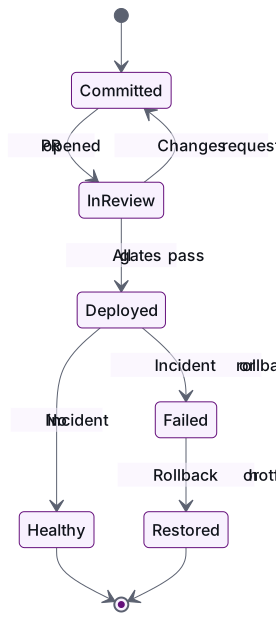
Every path that goes through Failed adds to change failure rate. The time spent in Failed is your recovery time. Every hotfix deployment adds to rework rate. Tag each change as AI-assisted or not when the pull request is opened. Then you can compare failure rates between the two groups instead of guessing.
How do review gates and test suites affect your DORA numbers?#
Good gates add a few minutes to lead time and take far more off change failure rate and recovery time. Weak gates do the opposite: the speed numbers look good now, and the instability shows up a few weeks later.
Calidad's standard is three gates on every release: tests prove it works, security checks prove it's safe, and a senior engineer's review proves it's right. That applies whether a person or an AI wrote the change. Here is what each gate does to the numbers:
- Fast, stable tests catch regressions before deployment. Flaky tests push engineers to rerun or skip them, which slows lead time and lets failures through.
- Security and dependency scans catch leaked secrets, packages that don't exist and vulnerable libraries. Fixing these after release counts as rework.
- Required review with size limits keeps batches small. DORA's 2025 research found working in small batches especially valuable for teams using AI.
For a step-by-step version, see how to verify AI-generated code before production.
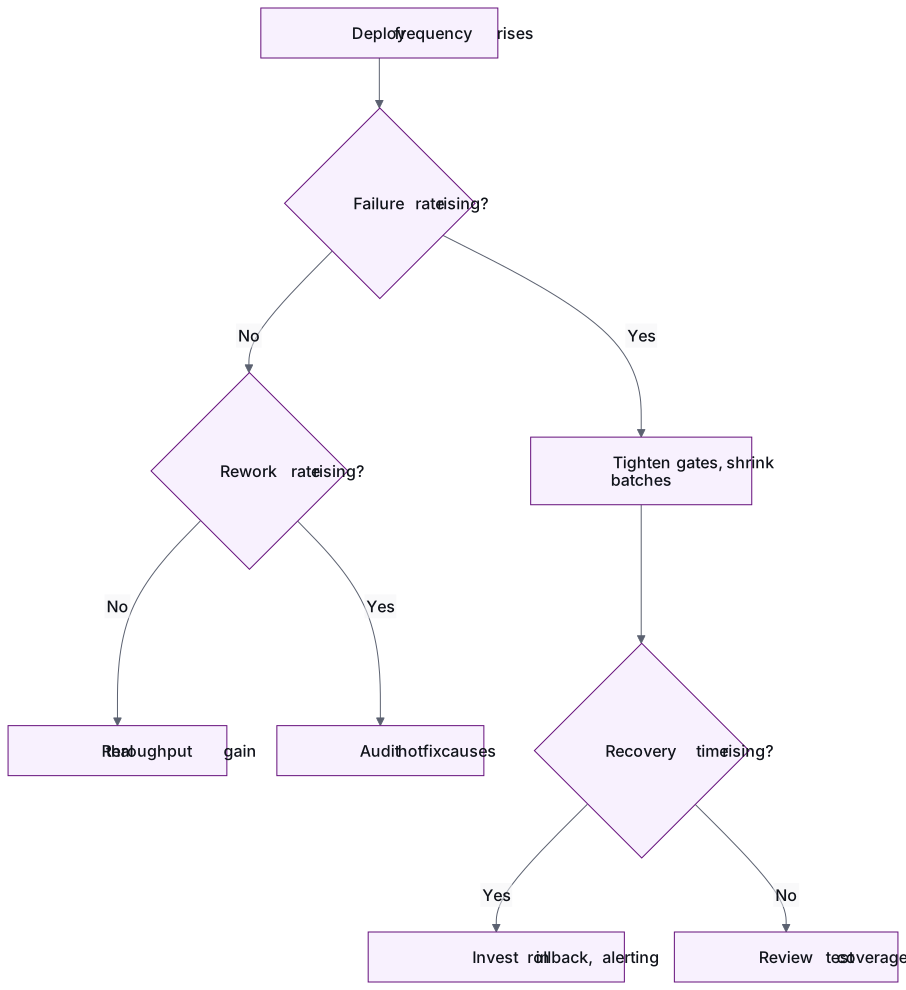
When a metric moves, check the stability metrics before you decide what it means:
How do DORA metrics connect to SLOs and recovery time?#
DORA metrics describe how changes move through the pipeline. Service level objectives (SLOs) describe what users actually experience. Recovery time is where the two meet. Define "failure" and "restored" using your SLOs, not tickets, and change failure rate and recovery time start measuring the impact on users.
In practice:
- Set SLOs users would recognize, such as checkout success or API latency at the 95th percentile. Avoid internal measures like CPU usage.
- Count a deployment as failed if it breaches an SLO within a set window after release, even if nobody opened an incident.
- Start recovery time at the SLO breach and stop it when the SLO is back within target.
- Use the error budget as a release brake. When a service has used up its budget, slow its deployments until it recovers. Deployment frequency will dip, and that is the right call.
Calidad's Observability & SRE practice sets SLOs your users would recognize, instruments services with OpenTelemetry and cuts alerts down to the ones that matter. Our DevOps practice builds pipelines with releases small enough to ship all day, so a bad change can be found and rolled back quickly.
What should engineering leaders report to the board instead of raw velocity?#
Report speed and stability side by side, by service, with a trend line, and connect them to what users experience. Lines of code, pull requests merged and the "share of code written by AI" measure activity. None of them shows whether customers are better off.
Here is a reporting set that holds up to questions:
- Throughput and instability, side by side. Deployment frequency and lead time next to change failure rate and rework rate. Don't show one pair without the other.
- SLO attainment for the three to five services that bring in revenue.
- Recovery time trend for failed deployments over the quarter.
- Gate health: the share of changes that pass tests, security checks and review on the first try, split by AI-assisted and human-written.
- One business outcome per investment, so AI tooling spend answers to a number the board already tracks.
Don't present elite/high/medium/low labels as the goal. DORA's 2025 report replaced those performance clusters with team archetypes, and your own trend matters more than a benchmark tier anyway.
Conclusion#
AI makes code cheap to produce, and that makes deployment frequency easy to inflate. Treat DORA metrics as one set. Count failures and recovery against SLOs, tag AI-assisted changes, and put every release through tests, security checks and review. Then a rise in speed is real progress and not a problem you'll find later.
If you want help building the pipeline, the gates and the SLOs that make these numbers trustworthy, Calidad starts with a paid pilot: one pod and one outcome, judged on working software. Talk to an engineering lead →
Frequently asked questions
Is there a fifth DORA metric?
Yes. In its 2024 report, DORA added rework rate as a stability measure. It counts unplanned deployments made to fix problems in production. DORA also moved recovery time into the throughput group. Many dashboards still show the original four keys, but rework rate is worth adding once AI writes a large share of your changes.
Should we track DORA metrics separately for AI-generated code?
Track them overall, and also add an "AI-assisted" tag to pull requests so you can compare the two groups. Comparing change failure rate and rework rate between them shows whether your review and test gates are catching AI-specific defects. Don't use the split to rank individual engineers.
How long before DORA trends are meaningful?
Use rolling windows of at least several weeks. DORA's Four Keys dashboard shows a 90-day snapshot alongside daily data. Short windows react too much to a single incident or a burst of small deployments. Compare quarter to quarter for board reporting.
Can DORA metrics be used to measure individual developer performance?
They work best at the team or service level, because deployments, failures and recoveries belong to systems, not to individuals. Using them to rate people encourages gaming, such as splitting changes to inflate deployment counts. Use them to find bottlenecks in the delivery system instead.
Do DORA's elite, high, medium and low tiers still apply?
DORA's 2025 report replaced those performance clusters with team archetypes. Older benchmark tables still circulate and give rough context. A better target is improving your own trend on both speed and stability at the same time.
- DORA metrics
- DevOps
- AI-generated code
- SRE
- Engineering leadership
Newsletter
Get new articles by email
A short monthly round-up of what we've written on engineering pods, quality and AI. No spam.
