
To measure the value of digital transformation, tie every engineering investment to three things before it starts: a measured baseline, one business metric it must move, and a stop rule that says when to cut it. Then report delivery, cost and business results against that baseline every quarter, so the board sees what the money bought.
Why do most digital transformation programs struggle to prove their value?#
Most programs can't prove their value because they never wrote down the starting point or the number they promised to move.
The research shows how often this goes wrong. BCG research found that 70% of digital transformations fall short of their objectives. A 2024 Gartner survey found that on average only 48% of digital initiatives meet or exceed their business outcome targets. McKinsey reports that organizations capture less than one-third of the value they expected from recent digital transformations.
The same patterns come up again and again:
- No baseline. "Faster releases" means nothing if nobody measured release speed before the program began.
- Activity reported as value. Services migrated, engineers hired and tickets closed are inputs. They are not outcomes.
- One budget for many bets. When ten initiatives share one budget line, the weak ones hide behind the strong ones.
- No exit. Without a stop rule, a stalled initiative keeps its funding because cutting it feels like admitting failure.
What should you baseline before a transformation starts?#
Baseline everything the program says it will change, measured the same way you will measure it later.
A useful baseline covers four areas:
- Delivery: how often you release, how long a change takes from commit to production, and how often releases fail.
- Reliability: incident count, time to restore service, and how many hours on-call engineers spend firefighting.
- Cost: current run cost of the systems in scope, split by product or team where possible, plus licence and support costs for legacy platforms.
- The business metric: the number the board cares about, such as order conversion, onboarding time, cost per transaction or time to launch in a new market.
Take the numbers from systems you already have (version control, CI/CD, incident tooling, cloud bills) rather than from surveys. If a metric can't be measured today, fix that first. Instrumentation is cheap compared with a programme you can't evaluate.
Our AI Strategy work starts the same way. Each candidate use case is scored on value, frequency, data access and risk against a measured baseline. The output is a ranked shortlist, and each item on it has a baseline metric and a target.

Which metrics link engineering work to business outcomes?#
Use a three-step chain for each investment: an engineering metric your team controls, an operational metric it affects, and a business metric the board recognizes.
Engineering metrics on their own don't persuade a board. Business metrics on their own can't be traced back to engineering decisions. The chain links the two:
| Investment | Engineering metric | Operational metric | Business metric |
|---|---|---|---|
| CI/CD and test automation | Lead time for changes | Features released per quarter | Time to launch a new product line |
| Legacy platform modernization | Change failure rate | Incident hours per month | Revenue lost to downtime; legacy run cost |
| Data platform rebuild | Pipeline freshness | Reports delivered on time | Decision cycle time; one agreed revenue figure |
| Generative AI feature | Evaluation score on real questions | Share of queries resolved without escalation | Support cost per customer |
Two rules keep the chain honest. First, choose one business metric per investment. If an investment claims five, it can't be judged on any of them. Second, agree who owns the business metric. Usually that is a product or business leader, not engineering, and agreeing it up front stops anyone from moving the goalposts later.
How do you measure delivery: release frequency, lead time and predictability?#
Measure delivery with the four DORA metrics, and add a predictability measure that shows whether teams deliver what they commit to.
The DORA metrics are deployment frequency, lead time for changes, change failure rate and recovery time. They are useful because they weigh speed against stability. A team that releases twice as often but breaks production twice as often hasn't improved.
Add predictability on top: the share of planned work for a quarter that actually shipped, and how far delivery dates slipped. Boards notice missed dates more than slow lead times.
AI-assisted development makes the stability side more important. When AI writes much of the code, deployment frequency and lead time can improve quickly while quality quietly gets worse. Report change failure rate and recovery time next to every speed metric. At Calidad, every change passes three gates before release, whether a person or an AI wrote it: tests, security checks and review by a senior engineer. That keeps the speed gains real.
How do you measure the value of platform modernization and cloud spend?#
Measure modernization by what it removes and what it makes possible. Measure cloud spend by unit cost, not by the total bill.
Modernization value usually shows up in four places:
- Run cost removed: legacy licences, hardware, support contracts and specialist maintenance that go away.
- Incident time reduced: fewer outages and faster recovery on the modernized systems.
- Change made cheaper: shorter lead time and fewer release blockers on the systems that used to slow every roadmap.
- Options created: products or integrations the old platform couldn't support. Count these only when they actually ship.
For cloud spend, a rising bill can be a good sign if usage is growing faster. The FinOps Foundation's Unit Economics capability describes how to tie technology costs to business value, with metrics such as cost per customer or cost per transaction. Report cost per unit of business activity, and break it down by product and team.
Phasing also improves measurement. On a migration, we move one low-risk workload first so the runbook is proven before anything critical moves. The results from that first workload then shape the rest of the plan, and you get real before-and-after numbers early. Our Cloud Cost Optimization practice aims for cloud and AI spend that follows usage and is visible per team and product.
How do you measure whether a GCC is creating value, not just headcount?#
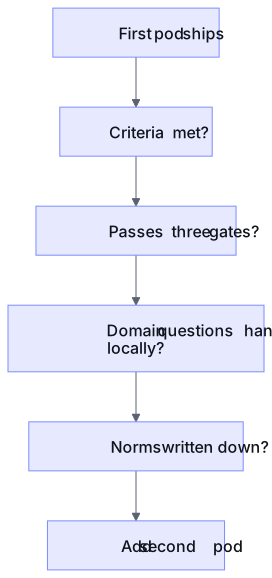
Measure a Global Capability Center by the output each pod ships against headquarters' quality bar, not by the number of seats filled.
Headcount is the easiest GCC number to report and the least useful. Track these instead:
- Time to first production release for each new pod.
- Share of the roadmap owned end to end by the center, rather than tasks handed over from headquarters.
- Quality parity: change failure rate and recovery time for the center compared with headquarters.
- Wait time: how long questions and approvals take to get answered across time zones.
- Context retention: engineer tenure on the same product area, because attrition resets domain knowledge.
Our GCC Enablement model applies this directly. A small senior pod takes on a real workstream first, and headcount follows proven output, never the other way round. Each new pod joins work that already ships, so every hire is backed by evidence.
How do pilots and stop criteria keep transformation spend accountable?#
A pilot turns a claim into a measured result before the large spend begins. Stop criteria make cutting a weak bet a decision agreed in advance rather than a political fight.
To run a pilot that produces evidence:
- Pick one outcome tied to a business metric from your baseline.
- Sign the success criteria before work starts. Include the target number, the measurement method and the date.
- Write the stop rule as well. For example: "If lead time hasn't fallen by the agreed amount by the review date, we stop or change scope."
- Judge working software, not status reports.
- Make the call: scale, adjust or stop, and record why.
Every Calidad engagement starts this way: a paid pilot with one pod and one outcome, with success criteria agreed up front and no long-term contract. Our AI Strategy roadmaps run for 90 days and include owners, milestones and stop criteria. Our guide to what a paid software vendor pilot needs covers the scoping in more detail.
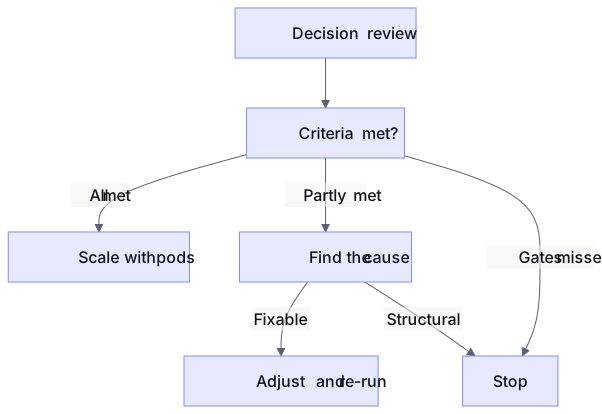
Stop rules also make your reporting more credible. A board that sees you stop one initiative will trust the numbers on the ones you keep funding.
What does a transformation value scorecard for the board look like?#
It's one page with one row per investment, showing spend, baseline, current value, target and a scale, adjust or stop status.
An example layout (the figures are for illustration only):
| Investment | Spend to date | Metric | Baseline | Now | Target | Status |
|---|---|---|---|---|---|---|
| CI/CD rebuild | $X | Lead time for changes | 12 days | 4 days | 2 days | Scale |
| Core platform modernization | $Y | Incident hours / month | 40 | 31 | 10 | Adjust |
| GCC pod 2 | $Z | Roadmap share owned | 0% | 15% | 30% | Scale |
| AI support assistant | $W | Cost per support ticket | $8.00 | $7.90 | $5.00 | Stop |
Keep the format the same every quarter so trends are easy to read. Add one line per row on what changed and why. Each status should point to the stop rule agreed at the start, so the decision is already explained.
Conclusion#
You can measure the value of digital transformation if you decide what to measure before spending starts. Baseline the current state. Link each investment to one business metric through delivery and operational measures. Prove it in a pilot. Then fund what moves the number and stop what doesn't. A one-page scorecard reported every quarter gives the board a clear account of what the money bought.
If you're planning a modernization or GCC program and want each investment to have a baseline and a stop rule from day one, talk to an engineering lead →
Frequently asked questions
How long does it take for digital transformation to show measurable value?
Delivery metrics such as lead time and deployment frequency often move within the first pilot, because they respond directly to engineering changes. Business metrics like conversion or cost per transaction usually lag by one or more quarters. Set a review date for each metric when you set the baseline, so a slow-moving number isn't mistaken for failure.
Should DORA metrics be reported to the board?
Report them as supporting evidence, not as the headline. Boards respond to business metrics such as time to market, downtime cost or unit cost. Show the DORA metrics as the engineering link in the chain that explains why the business metric moved.
What if our transformation is already under way and we never set a baseline?
Rebuild one from historical data in version control, CI/CD logs, incident tools and cloud bills, which usually go back months. Where the history doesn't exist, measure today's state now and treat it as the baseline from here on. Then set targets and stop rules for each initiative from this point forward.
How do you measure the value of AI coding tools inside a transformation program?
Measure them through the same delivery metrics, always pairing speed with stability. If lead time falls but change failure rate or recovery time rises, the tools are creating rework, not value. Make sure every AI-written change goes through tests, security checks and review, so the gains you report hold up in production.
What makes a good stop rule?
A good stop rule names a metric, a threshold and a date. For example: "If cost per transaction hasn't fallen 10% by the end of the quarter, we stop or rescope." It is agreed before funding, owned by a named person, and leads to a scale, adjust or stop decision that is recorded.
- digital transformation
- DORA metrics
- FinOps
- GCC
- engineering metrics
- board reporting
Newsletter
Get new articles by email
A short monthly round-up of what we've written on engineering pods, quality and AI. No spam.
